
AI-Powered Planning and Design, for Better Project Delivery and Urban Developments
GET STARTED


© 2023 DigitalBlueFoam

Unlocking the Potential of Urban Green Spaces with Multispectral Imagery and Spatial Analytics
Hi, it's Mukesh, a Geoinformatics Engineer and Cesar Head of Product at DBF. We are passionate about creating evidence-based tools to improve the built environment. In this blog post, we look at the development of a universal green index and how that can be used to inform more livable neighborhoods.
Introduction
Recently, the concept of the “15-minute city” has taken center stage in city discussions. An important consideration for this concept is the accessibility of green spaces within a short walking distance. Enter the Urban Green Space Index (UGS Index) -- a pivotal metric that evaluates and enhances the availability of green spaces (Gupta et al., 2012).
In this blog, we will delve into the significance of the UGS Index, how we are able to compute it using novel datasets and analysis techniques, and how it can be leveraged in urban design to drive a variety of benefits for cities, including recreational areas, urban heat island mitigation, CO2 reduction, and flood prevention.
Background
The Power of Urban Green Spaces:
Urban green spaces, including parks, gardens, and public squares, offer many benefits to city dwellers (Gupta et al., 2016). They serve as vital hubs for relaxation, recreation, and social interactions, fostering strong community bonds. Moreover, green spaces contribute to environmental sustainability by improving air quality, mitigating the urban heat island effect, and supporting biodiversity.
Accessible urban green spaces significantly impact the well-being of city residents and workers. Regular exposure to green spaces has been linked to improved mental health, reduced stress levels, and enhanced cognitive function. Additionally, they provide ample opportunities for physical activity, contributing to a healthier and more active lifestyle.
Embracing the 15-Minute Walkability Principle:
An urban revolution lies in the 15-minute walkability principle, which advocates for essential amenities, including urban green spaces, to be readily accessible within a 15-minute walk (Moreno et al., 2021). By incorporating this principle into urban planning, cities can reduce car dependency, promote active transportation, and elevate the overall quality of life for both residents and workers.
The Urban Green Space Index: Unleashing Urban Potential:
The Urban Green Space Index stands as a vital tool in gauging the availability and accessibility of green spaces in urban regions. By quantifying the amount of green space per capita, considering factors such as park area, proximity to residential and commercial areas, and walkability (Leslie et al., 2010), the UGS Index empowers city planners to identify areas with insufficient green spaces and prioritize their development, ensuring equitable access for all residents.
Methodology
The Potential of Multispectral Imagery:
With the aim of facilitating this analysis to urban planners and designers, our team at DBF developed a pipeline to evaluate accessibility to urban green spaces within a 15 min walk distance. The system uses Copernicus Sentinel 2 satellite global data set to fetch remote sense imagery, using the source imagery our algorithm processes multispectral bands of imagery, with the NDVI band ratioing techniques.

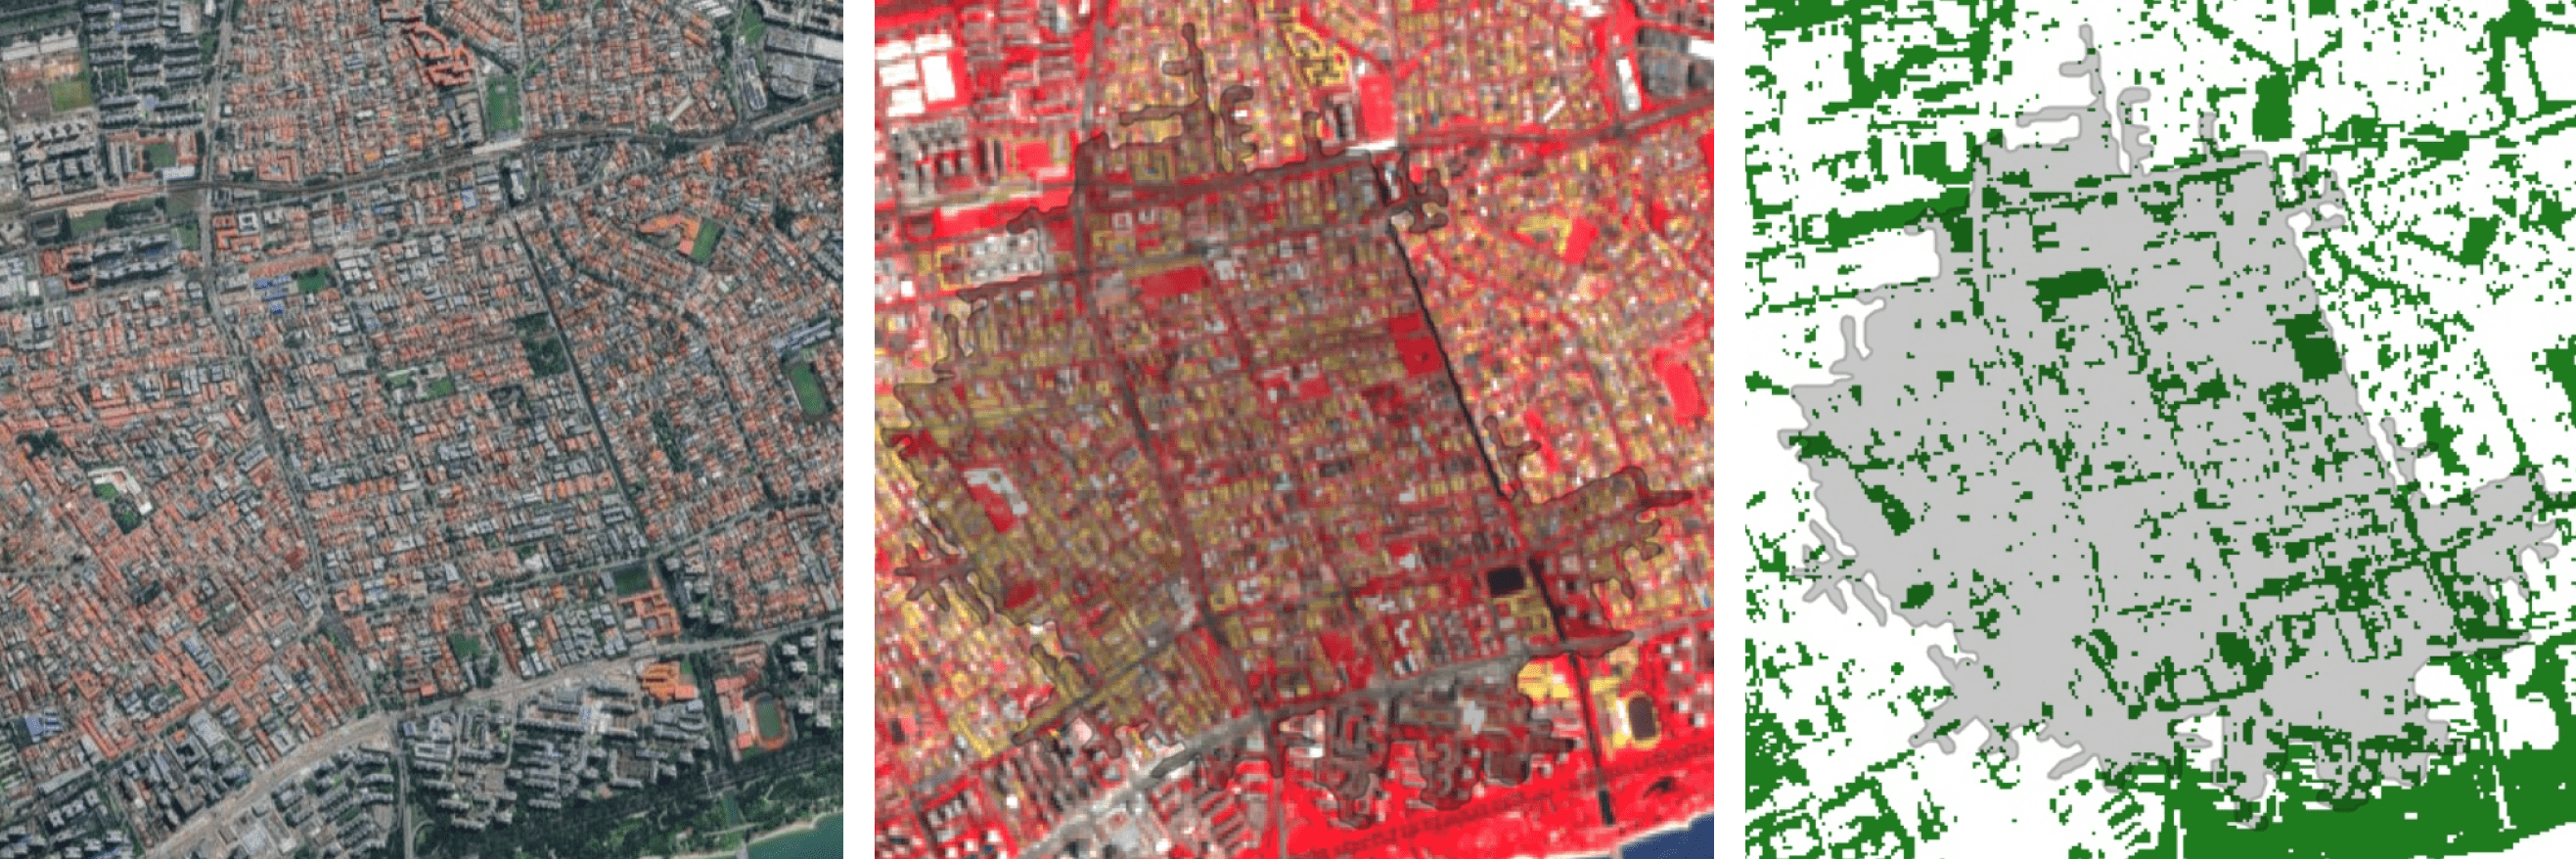
By using band ratioing, we can enhance the interpretation of the satellite images, allowing us to emphasize specific features within the image. In particular, we can isolate and highlight the vegetation present in the area under analysis. This enables us to calculate the percentage of vegetation coverage in that particular region, providing valuable insights into the green spaces available in the urban environment.
With this information, we can quickly identify areas in the city that lack sufficient vegetation, helping urban planners and designers pinpoint locations that would benefit the most from additional green spaces. Our approach offers an objective evaluation metric to guide the decision-making process and promote the integration of more greenery into urban landscapes.
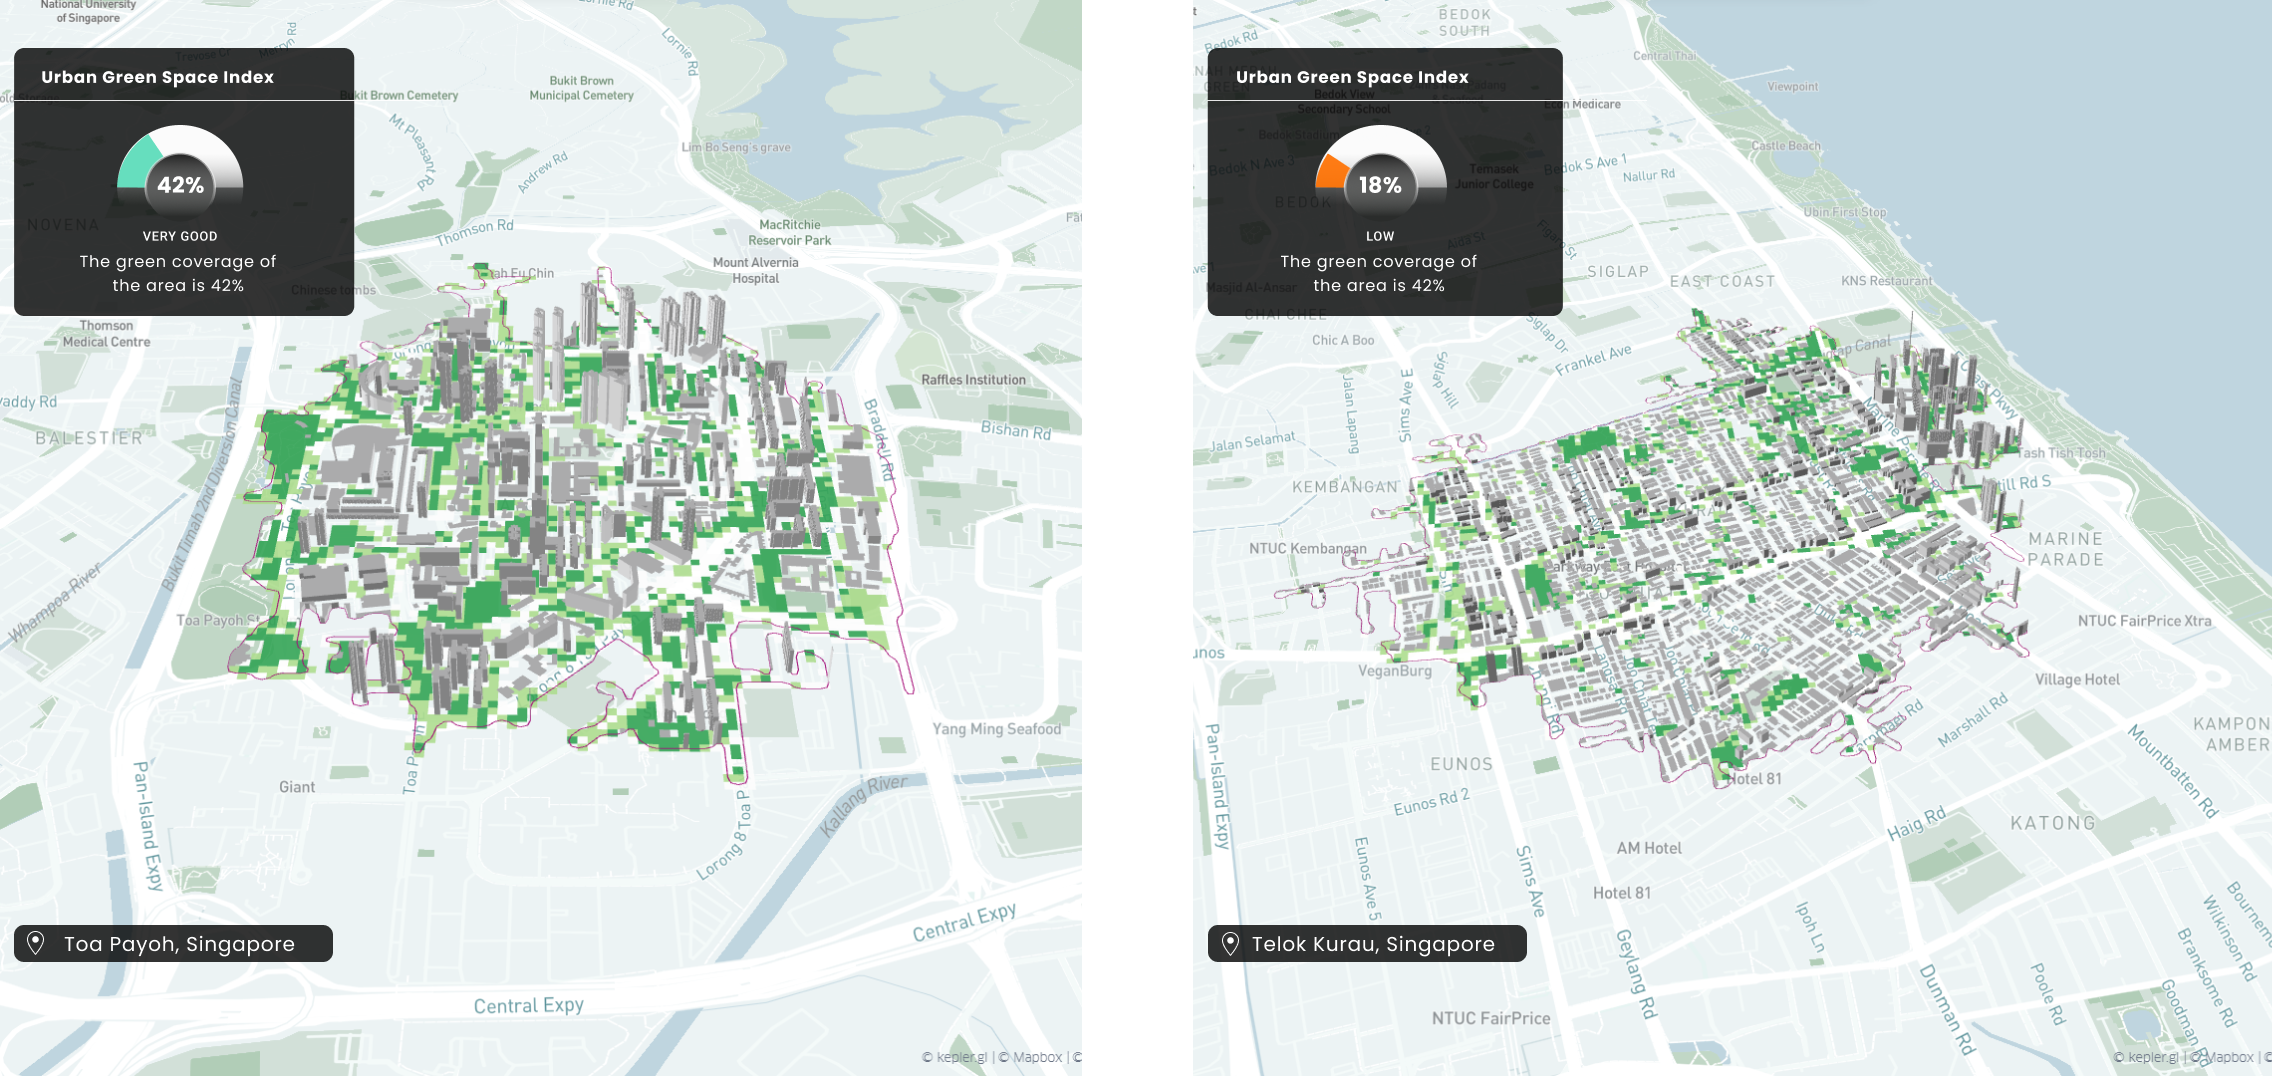
Here is an example of two areas in Singapore that we can compare using the Urban Green Space Index. Figure 1. Shows Toa Payoh neighborhood, scoring at 42% , in this area we can easily identify the distribution and coverage of vegetation across the neighborhood. In this area we can expect that residents benefit from access to parks for recreation, natural passive cooling and shaded walkways. All of these factors contribute to increasing the quality of life for residents by creating a more walkable and accessible environment.
As a stark contrast Figure 2. Shows Telok Kurau neighborhood, which presents low levels of vegetation coverage. Some negative effects that challenge and decrease the quality of life for residents in this area are: higher daytime temperatures, reduced nighttime cooling, and higher air-pollution levels due to urban heat island effects. As global temperatures rise, the effect could represent health risks for citizens which could be mitigated with higher levels of vegetation in the area. Additionally, walking access to key facilities is hindered due to poor shading along the streets, causing residents to opt to take car trips in order to meet their daily needs.
Improving Livability and Well-being:
With DBF Urban Insights, urban planners and designers can easily diagnose the state of a neighborhood across key metrics on accessibility to key services and amenities. The Urban Green Space Index provides an additional layer of information that helps measure qualitative aspects of the environment, such as how comfortable it is to walk across the streets of the neighborhood, or how well distributed is the vegetation throughout the neighborhood. In areas where the Urban Green Space Index scores low, urban planners can implement key strategies for introducing trees and vegetation into a neighborhood to enhance the urban environment and promote sustainable development. Some of these strategies include:
1. Planting trees strategically along pathways and access roads to provide shade and improve the pedestrian experience,
2. Repurposing underutilized spaces into small parks to foster community engagement and recreational opportunities.
3. Implement green infrastructure solutions to mitigate the urban heat island effect as well as reduced stormwater runoff, and increased biodiversity.
Conclusion:
The Urban Green Space Index, coupled with multispectral imagery, holds the key to unlocking vibrant and sustainable cities. As we prioritize the development of urban green spaces, we not only enhance the quality of life for residents and workers but also foster healthier, happier, and more environmentally conscious urban environments for generations to come. Embrace the 15-minute city with open arms, and witness the transformative power of accessible urban greenery unfold before your eyes.
City planners appreciate the significance of urban green spaces and their seamless integration within the 15-minute city framework. Their goal is to create inclusive and sustainable cities, ensuring that green spaces are strategically located, well-connected, and adequately maintained (Addas, 2023). With the UGS Index, supported by multispectral imagery, city planners can make data-driven decisions, allocate resources effectively, and foster greener and more livable urban environments.
References: