
AI-Powered Planning and Design, for Better Project Delivery and Urban Developments
GET STARTED


© 2023 DigitalBlueFoam

Learn how DBF leverages AI to enhance city planning through text-based insights and spatial correlations.

Hi, it’s Rutvik and Naomi from DBF. We are passionate about creating evidence-based tools to improve the built environment. Having worked on projects like developing Large Language Models (LLM) for predicting 15-minute city scenarios and gamifying urban developments, we are excited to share our journey of developing Urban Insight Analysis. In this blog post, we harness the power of GPT to generate actionable insights, aiming to contribute to the creation of better cities through innovative technologies.
When it comes to evaluating the performance of a neighborhood, having comprehensive quantitative evaluation metrics is undoubtedly valuable. DBF has introduced standardized metrics such as fulfillment score, diversity score, proximity score, CO2 score, and density score, enabling data-driven decision-making within the context of the 15-minute city framework [1]. However, interpreting these results often requires an expert level of knowledge, making it challenging for various stakeholders, including architects, tourists, city planners, developers, and residents, to fully grasp and act upon the findings. This is where text-based insights, in the form of natural language, step in to bridge the gap.
The idea of integrating Language Language Models (LLMs) to create recommendation engines for neighborhood design ideation has been explored previously [2]. The GPT3 base model was fine-tuned with a structured dataset consisting of real world examples to generate design proposals in the form of natural language. One of the key challenges faced was that the generated solutions were often semantically similar due to lack of diversity in the dataset. In this project, the LLM by Open AI, GPT-3 [3] was used to interpret the 15" CIty Key Performance Indicators (KPIs) and generate smarter insights & design recommendations rather than fine-tuning the model on a dataset.
To understand how we could leverage chat GPT, we embarked on some initial experiments. We first identified potential use cases in which text-based output can be useful.
We were curious, how we could translate 15" City metrics can be a valuable insight in the form of natural language. The example is for a neighborhood located in Adelaide, Australia.


Text-based insights in urban evaluations provide a deeper understanding of a neighborhood's performance by capturing its historical, cultural, and social contexts. These insights go beyond numbers, revealing connections and trends that quantitative metrics may miss. By incorporating qualitative aspects, they enrich the evaluation process, promoting a more inclusive and people-centric approach to urban planning and development.
Following are some of the advantages of text-based insights over numerical metrics:
1) Contextual Understanding
2) Uncovering Hidden Patterns
3) Subjective and Qualitative Aspects
We have explored how we can get actionable insights from the data, and not just qualitative analysis. We referred to the SWOT framework and looked into how we can generate this using GPT. For the purpose of generating SWOT analysis, we used results from 3 analyses (i.e. Fulfillment, Diversity and Proximity) that we have developed previously as input into the GPT. In essence, what we did was to build a layer of insight generation, on top of our proprietary data.

Below is a sample result that we obtained for Singapore.

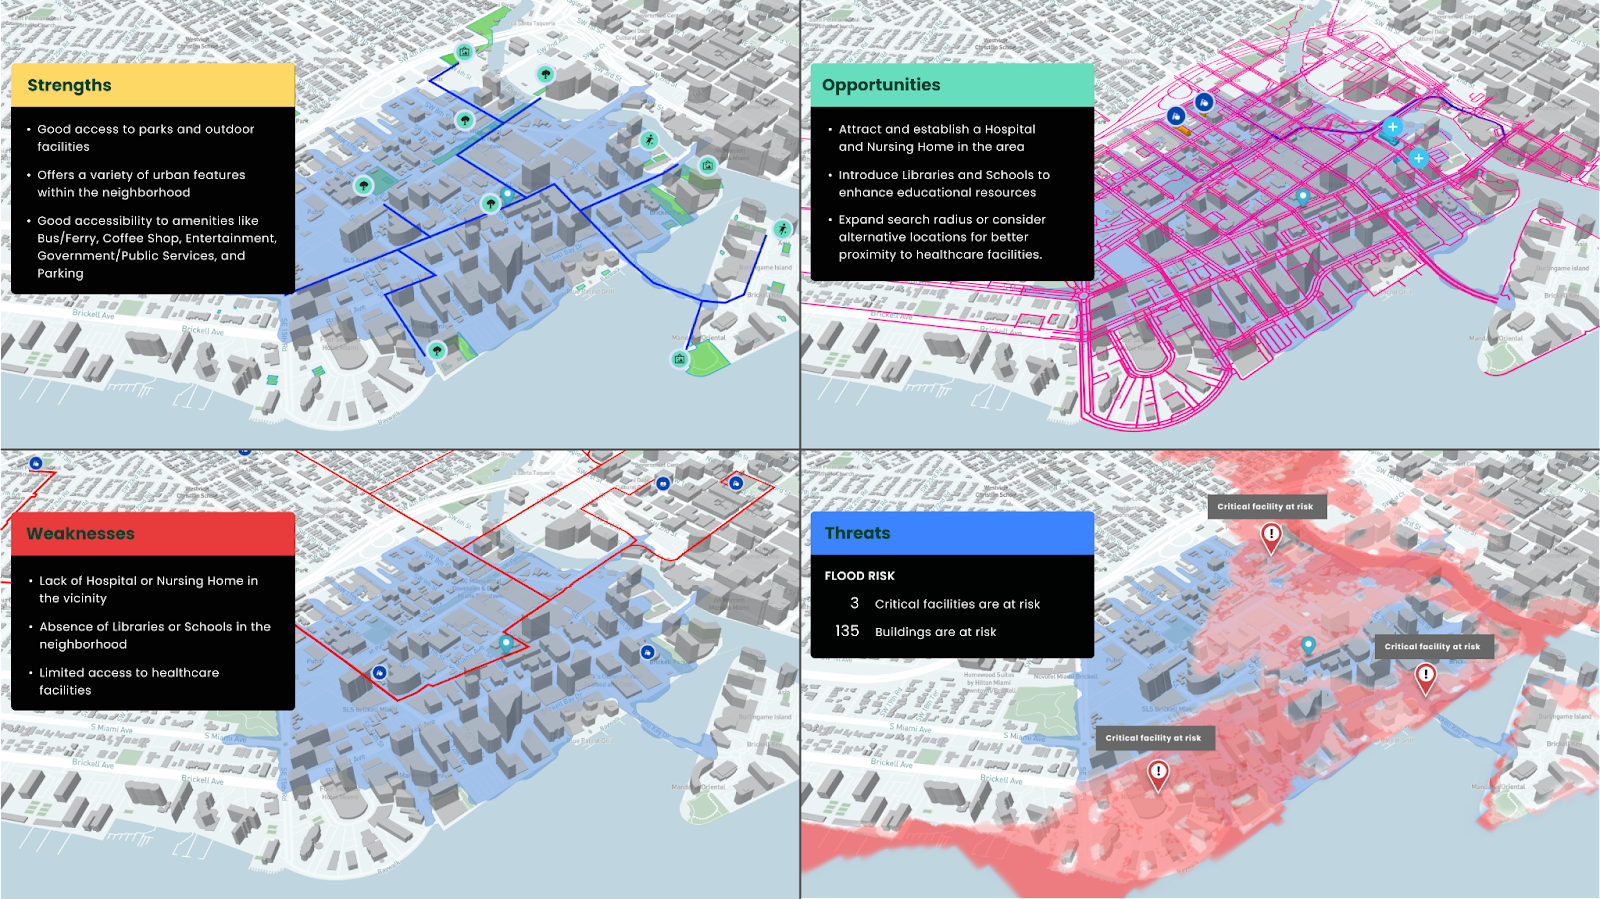
Here, we used GPT to generate the Strengths, Weaknesses and Opportunities. For the Threats section, we plan to give users access to various climate-related threat analysis such as flood risk, urban heat island and earthquake risk. This will be specific to their countries, as different countries would have different dataset available, in different formats.
To make the insights more valuable to users, we believe that Linking the map data to the texts shown is important as it gives a spatial quality to the insights.
We created a use case where this feature could have a storytelling mode. This can be a tool to assist urban planners and designers in narrating their vision for the neighborhood. Below is a sample we did for Brickell, Miami. The idea is for different features in the map to be highlighted, corresponding to whether Strengths, Weaknesses, Opportunities or Threats are selected.
.gif)
By incorporating spatial qualities to the analysis, users can quickly identify locations which need interventions. For example, users can identify the missing amenities, see how far someone would need to travel beyond the 15” isochrone and start to identify where the new amenities should be introduced.
When evaluating a neighborhood using metrics like fulfillment score and diversity score, it becomes apparent which essential facilities are lacking. These metrics provide users with a clear understanding of the existing gaps and areas for improvement within the neighborhood. However, identifying these missing facilities is only the first step.
For example a neighborhood can score low on learning and caring because there aren't enough schools, libraries, hospitals or clinics to serve the population. Urban insights highlights the top most critical facilities missing.
The next crucial question is: How can we determine the ideal locations for these new facilities?
To address this challenge, we propose a rule-based algorithm that facilitates the identification of optimal locations for the new facilities. The algorithm incorporates default rules centered around factors such as proximity to public transportation (including metro stations and bus stops), existing similar facilities, street connectivity and risks (e.g. flood risk and urban heat island). Then the algorithm rates suitable locations based on these rules and presents the most ideal places to build this facility.
.gif)
One key aspect of evaluating the positive changes of these proposed new facilities is to measure the improvement in the fulfillment score and diversity score of the neighborhood. These metrics serve as objective indicators of how well the needs and preferences of residents are being met and how diverse and inclusive the community is becoming. By comparing the scores before and after implementing the new facilities, users can quantitatively assess the positive impact of their interventions on the neighborhood's overall performance.
So far we have used the DBF analysis data to act as input in the generation of insights. In the future we can look into augmenting it with other data sources such as demographic data, land use and even qualitative data from Wikipedia. The foreseeable challenge here is the inconsistency of data (formats and availability) across geographical locations. One way to deal with this is to narrow the scope of the exploration to a specific city or country, and slowly expand to cover more geographical areas.
While leveraging the power of GPT-3.5 has been instrumental in generating insightful analyses from DBF data, it's essential to acknowledge certain technical limitations. It may not have access to the most up-to-date information or specific localized data, which can present challenges when augmenting the analysis with additional data sources.
We explored how to leverage GPT and draw insights from how many? data points. There is value in being able to get SWOT analysis quickly for different sites. It becomes more interesting when we start to make spatial correlations to the texts. Meanwhile, location recommendations can reduce the time required for users to select a site and could potentially choose better sites than manual selection too. All this will contribute to the overall mission of designing better cities.