
AI-Powered Planning and Design, for Better Project Delivery and Urban Developments
GET STARTED


© 2023 DigitalBlueFoam

Redefining Neighbourhood Design with Transportation CO2 Analysis

.gif)
Hi, it’s Aleksei, a sustainability-focused PhD researcher/data scientist, and Cesar, Head of Product at DBF. As urban technology developers, our goal is to tackle carbon emissions in the built environment. In this blog post, we discuss the impact of transportation on climate change and present our data-driven solution to quantify neighborhood transportation CO2 emissions and identify their reduction strategies.
Transportation causes 20% of global CO2 emissions. In developed car-dependent countries like the United States, transportation accounts for a whopping 30% of total emissions! The primary cause of transportation emissions is the combustion of fossil fuels in cars, trucks, ships, and airplanes. These fossil fuels, primarily gasoline, and diesel, release carbon dioxide (CO2), along with other pollutants like nitrogen oxides (NOx) and particulate matter (PM.) These emissions are a major environmental concern due to their impact on air quality, global temperature, and public health. As a result, there is an urgent need to support reduction strategies. Two approaches commonly discussed are the transition to Electric Vehicles (EVs) and the promotion of Public Transportation systems. However, in this post, we will discuss a third strategy, that in our opinion is not discussed enough — sustainable urban planning. You do not need to think about a more sustainable way to use your car if you do not need one, right? It is possible to reduce transportation CO2 emissions by implementing a few key urban design principles:

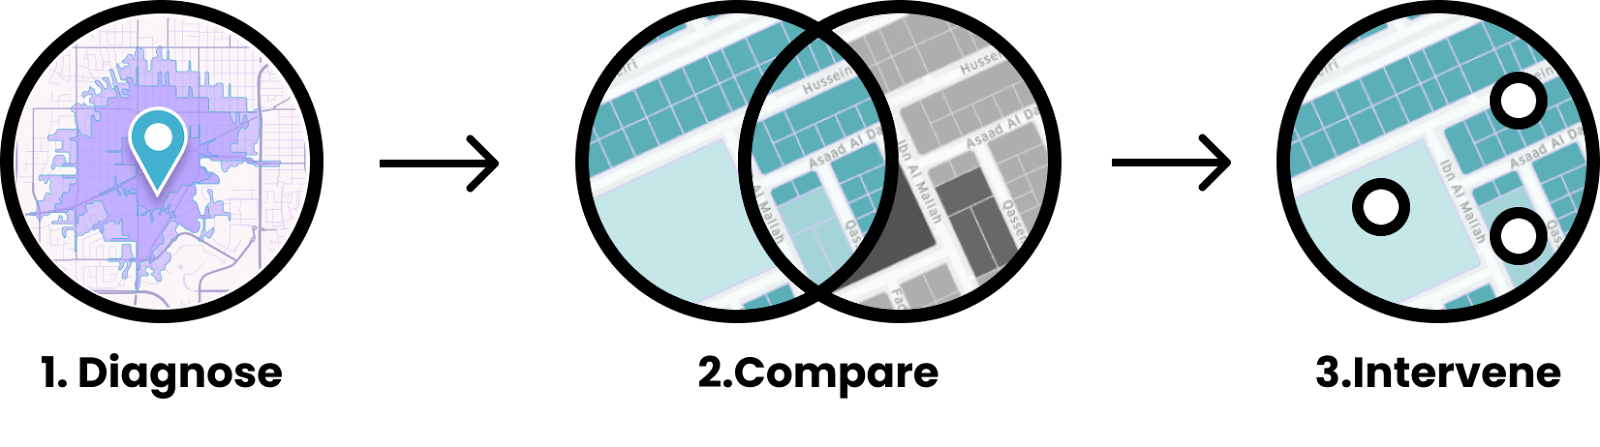
To reduce transportation CO2 emissions via urban design we need tools to quantify the problem so we can find the best strategy to solve it. At DBF, we are developing a methodology and digital analytics to do just that for any neighborhood in the World using the following methodology:
Quantifying neighborhood CO2 emissions is just the beginning. We need to get a better understanding of the output number to put it in context. We can do it either globally (comparing with other neighborhoods around the world) or locally (comparing with neighborhoods in the vicinity of the chosen one). In this way, we can have a clear picture of how far our neighborhood is from the state-of-the-art ones in terms of transportation CO2 emissions caused by its inhabitants. The comparison should be fair regardless of the climate zone since fundamental human needs are more or less similar around the world. But what can we do to reduce the emissions and how can we see the impact of our potential intervention? Traditionally city municipalities and urban planners take months and years to elaborate studies to guide the development of a city or district. However, the fast pace of urban development and the pressing need to mitigate climate change demands faster response times and constant monitoring to take action and measure our outcomes. DBF leverages urban data to generate smart recommendations and simulate scenarios for urban transformation while keeping track of how these actions will contribute to reducing CO2 emissions. In the following chapters, we will discuss the case study where we applied our tactical urbanism strategies for a data-driven repositioning of a critical amenity.
To explore the potential of this methodology, we analyzed two neighborhoods: one in Milan and another in Calgary. Please note, that for all analyses we assume the population size equal to 23 000 people in the neighborhood. We did that for the sake of consistency and fairness of the analysis and gave the result as a sum for the whole neighborhood’s population. Therefore, even if the exact number of CO2 emissions can be different from reality it does not affect the conclusions, since the result is normalized by having the same population.


The analysis reveals that transportation emissions resulting from car usage are two times higher in Calgary compared to Milan. This disparity can be attributed to the stark contrast in the availability of amenities within a 15-minute walking distance in these two cities. The neighborhood in Milan boasts a significantly higher number of amenities within the walkable isochrone, and even those located outside of this range are still reasonably accessible. The municipality prioritizes pedestrians and public transport over cars which leads to a compact urban design [3] where almost all the needed amenities are located within walking distance for locals.
Conversely, in Calgary, the sparse urban design strategy has been used where non-residential and residential buildings are clearly separated [4]. It leads to just a few needed amenities within walking distance. Moreover, the amenities that are not within walking distance are situated quite far away, necessitating long car trips to reach them. This spatial arrangement contributes to higher CO2 emissions in Calgary due to the greater reliance on cars for accessing essential services.
Rutland Park in Calgary generates higher levels of CO2 emissions compared to other neighborhoods in Europe, Asia, and America. A quick comparison shows that this neighborhood is more car-dependent than others, generating 10 times more emissions than Midtown Manhattan and 2 times more than a Citta Studi in the East of Milan. This neighborhood is very close to the emissions levels of Los Angeles, a city well known for poor connectivity and car dependence.
Now, let us quickly look at the district to determine if the area as a whole is underserved of key services and therefore would benefit from introducing or repositioning facilities to serve the population and decrease emissions for this area of the city.

Our local analysis shows that 4 neighborhoods in the west side of Calgary are generating high levels of transportation CO2 emissions due to low accessibility to key amenities. We looked at trips to hospitals to understand the impact of positioning a new facility closer to this area of the city.
Urban Insights provides a list of the most critical facilities missing in the area and shows us the corresponding CO2 emissions generated by residents taking long trips to meet their needs.

Once we know which facilities are contributing the most to generating CO2 Emissions we can simulate scenarios for repositioning or introducing new ones. In the image below we can see 4 new locations suitable for a hospital. Subsequently, we perform calculations for each potential location to determine which one generates the least emissions, thus having the most significant impact on improving residents’ access to healthcare facilities in this specific area of Calgary.

The simulation shows the impact that a new facility in this area would represent on the city. By positioning the new hospital in this area we could cut down emissions by more than half for the neighborhoods in the west side of Calgary. On the top chart, we see the amount by which CO2 emissions are cut down for each of the neighborhoods. Adding a hospital facility in this area would have a major impact on the emissions of these neighborhoods, but which location is the best to serve all 4 neighborhoods while achieving the most CO2 reductions? On the bottom chart, we compared the environmental impact for each of the potential locations. Location 2 proves to be the most central to serve this area of the city and achieves the greatest CO2 reductions. Similarly, we can simulate new locations for other key facilities like libraries or schools and measure the impact of repositioning these facilities to better serve the city and its residents.
Transportation is one of the largest contributors to climate change, and the implementation of sustainable urban design strategies like the “15-minute city” is necessary to address this pressing issue. However, to effectively tackle this problem, it is crucial to have data-driven tools that can quantify the extent of the issue and evaluate the potential impact of interventions in specific neighborhoods. At DBF, we are actively developing such tools to assist cities in their transition toward a more sustainable future. By utilizing these tools, decision-makers can make informed choices, backed by comprehensive data analysis, to optimize urban planning, reduce transportation emissions, and promote environmentally friendly practices.
Even though DBF urban insights is already capable of providing valuable information for the reduction of neighborhood’s transportation CO2 emissions, there are ways to improve it. We can connect real population data to our analysis to improve the calculations and give the final result per capita. Now we consider that all the trips outside of the walking area will be executed by car. However, in a lot of cities, it can be easily done by public transport (metro, buses, and trams). Therefore, in the near future, we will include public transportation routes as an alternative to car driving. Moreover, even cars can emit different amounts of CO2 emissions for the same trip distance depending on the fuel used. Consequently, we will consider the alternative of using EVs instead of typical cars, depending on the EV usage rate in a country. Stay tuned!